Visualize coordinate transformations on the sky#
Produce sky plots in a given coordinate system with the meridians and parallels for another coordinate system overlayed. This reproduces figures 3.1.2 to 3.1.7 in the Hipparcos and Tycho Catalogues Volume 1.
import numpy as np
import matplotlib.pyplot as plt

from pygaia.plot.sky import plot_coordinate_transformation_on_sky
from pygaia.astrometry.coordinates import Transformations
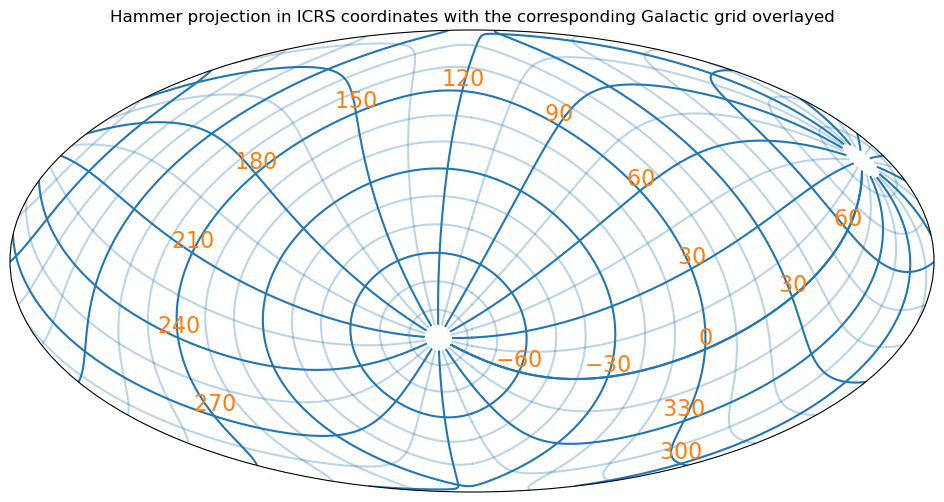
Show sky in ICRS coordinates with Galactic coordinate grid overlayed#
NOTE This means the transformation Transformations.GAL2ICRS should be provided as parameter to the plot_coordinate_transformation function.
fig = plt.figure(figsize=(12, 6))
plot_coordinate_transformation_on_sky(Transformations.GAL2ICRS, fig)
plt.show()
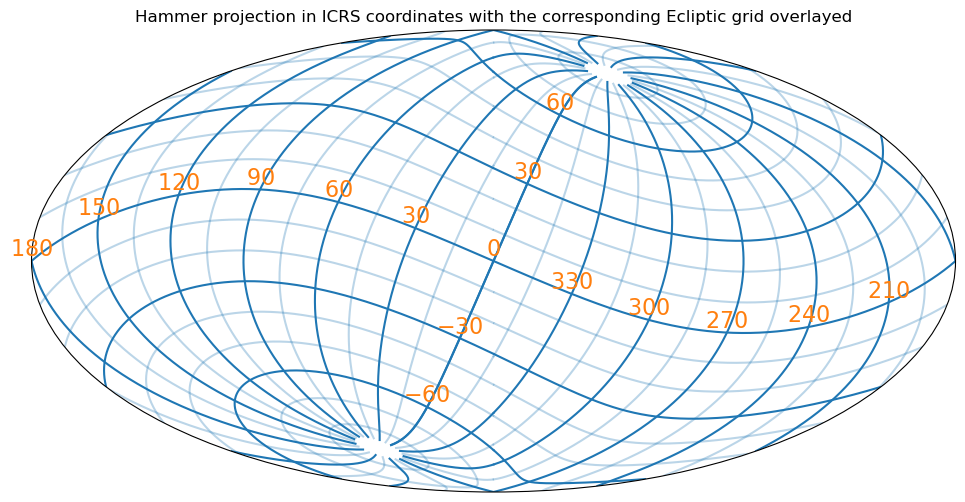
Show sky in ICRS coordinates with Ecliptic coordinate grid overlayed#
NOTE This means the transformation Transformations.ECL2ICRS should be provided as parameter to the plot_coordinate_transformation function.
fig = plt.figure(figsize=(12, 6))
plot_coordinate_transformation_on_sky(Transformations.ECL2ICRS, fig)
plt.show()
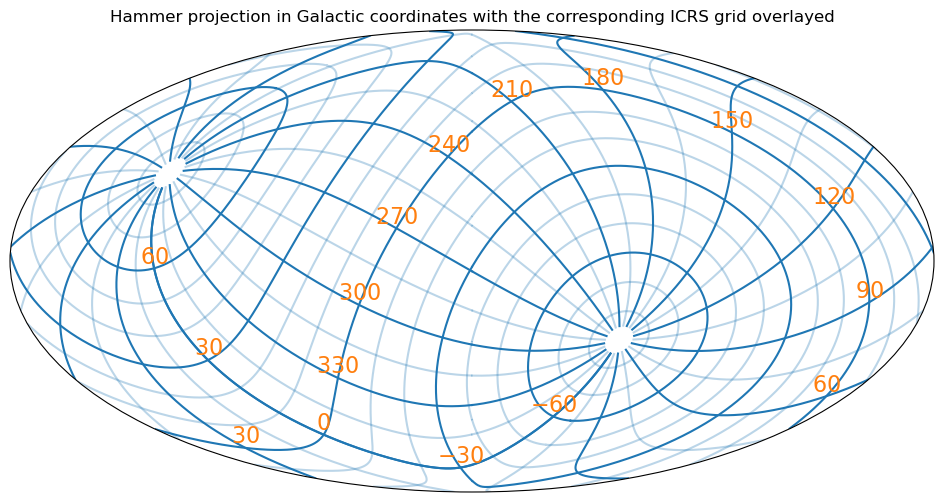
Show sky in Galactic coordinates with ICRS coordinate grid overlayed#
fig = plt.figure(figsize=(12, 6))
plot_coordinate_transformation_on_sky(Transformations.ICRS2GAL, fig)
plt.show()
Show sky in Galactic coordinates with Ecliptic coordinate grid overlayed#
fig = plt.figure(figsize=(12, 6))
plot_coordinate_transformation_on_sky(Transformations.ECL2GAL, fig)
plt.show()

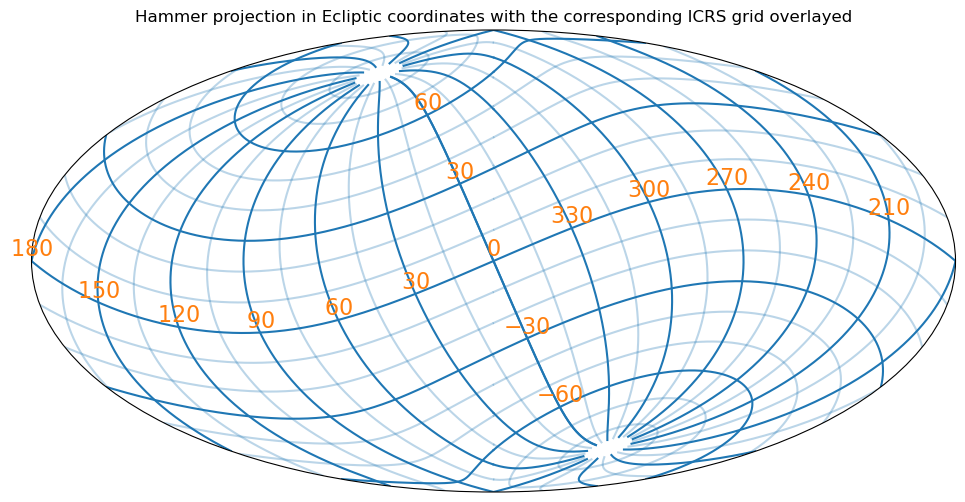
Show sky in Ecliptic coordinates with ICRS coordinate grid overlayed#
fig = plt.figure(figsize=(12, 6))
plot_coordinate_transformation_on_sky(Transformations.ICRS2ECL, fig)
plt.show()
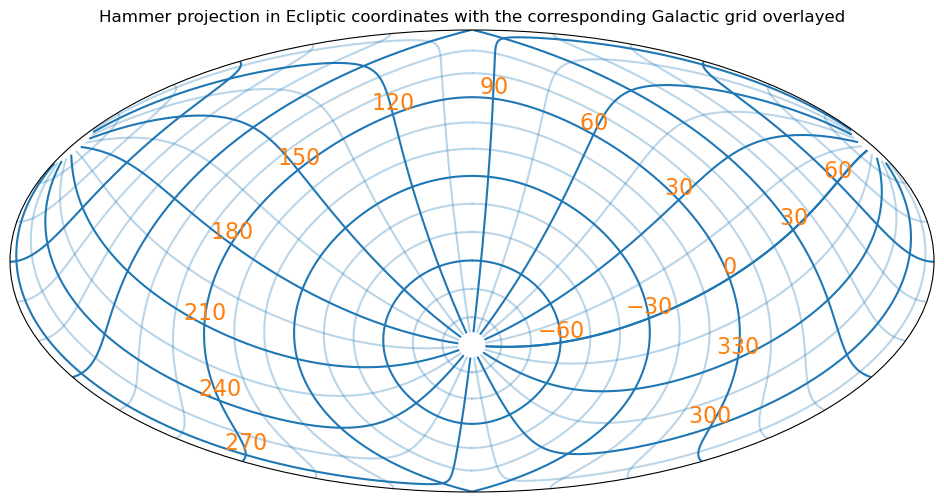
Show sky in Ecliptic coordinates with Galactic coordinate grid overlayed#
fig = plt.figure(figsize=(12, 6))
plot_coordinate_transformation_on_sky(Transformations.GAL2ECL, fig)
plt.show()