Show relative precision of Gaia DR3 parallaxes#
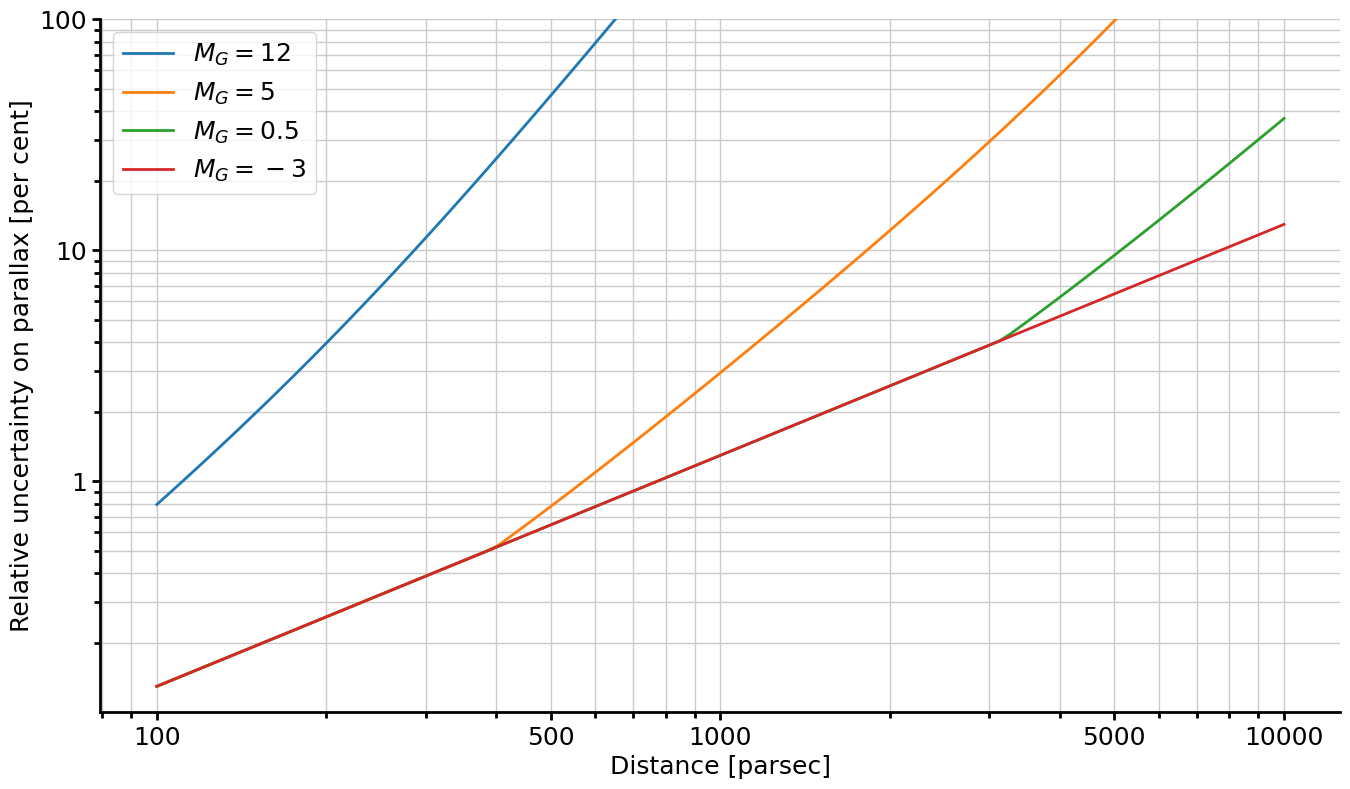
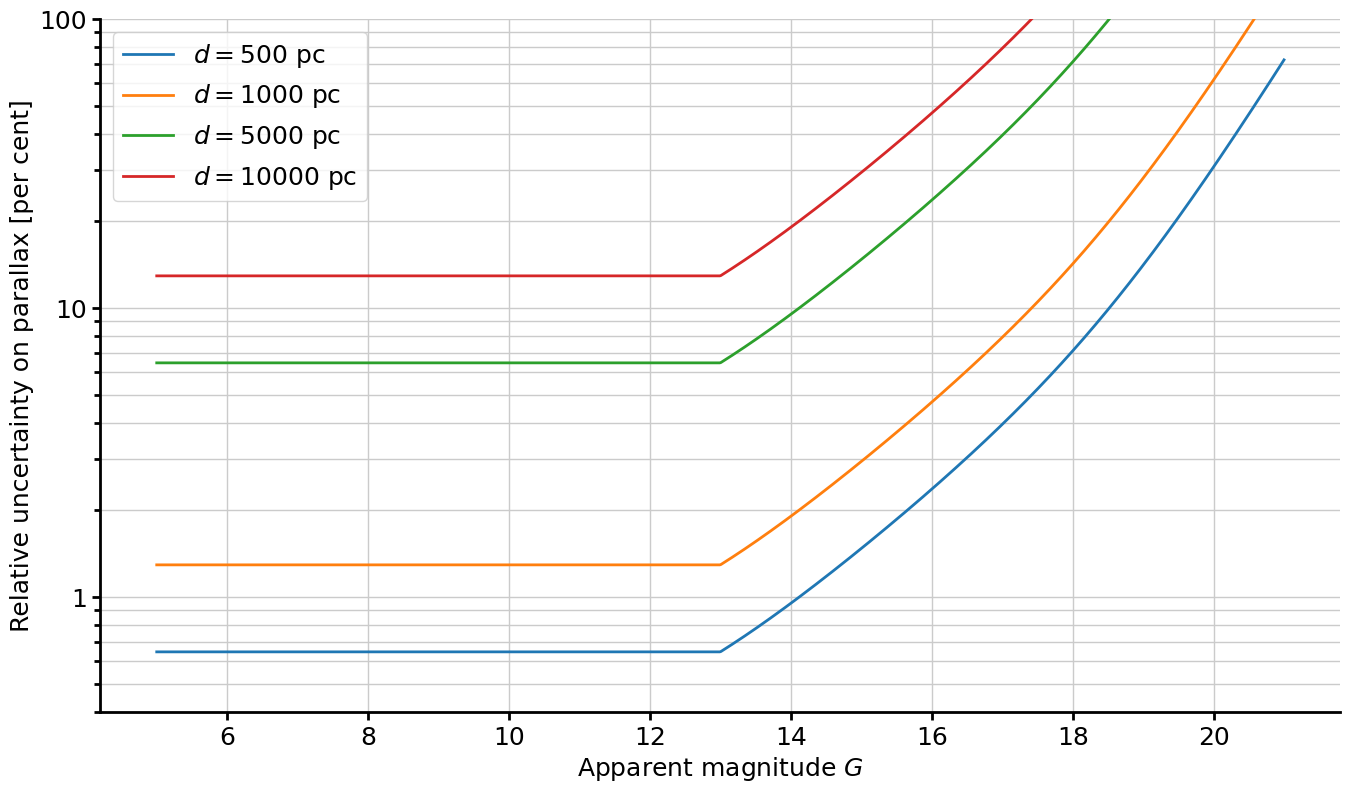
The relative precision is shown as a function of \(G\) for a fixed distance, or as a funcion of distance for fixed \(M_G\).
import numpy as np
import matplotlib.pyplot as plt

from pygaia.errors.astrometric import parallax_uncertainty

plt.style.use("./agab.mplstyle")
gmag = np.linspace(5, 21, 1000)
plx_unc = parallax_uncertainty(gmag, release="dr3")
dists = [500, 1000, 5000, 10000]
rel_plx_unc = np.zeros((len(dists), gmag.size))
for i, d in enumerate(dists):
    rel_plx_unc[i, :] = plx_unc / (1000000 / d) * 100

fig, ax = plt.subplots(1, 1, figsize=(16, 9))

for i, d in enumerate(dists):
    ax.semilogy(gmag, rel_plx_unc[i], "-", label=rf"$d={d}$ pc")
# ax.set_xlabel(r'Schijnbare magnitude $G$')
# ax.set_ylabel(r'Relatieve onzekerheid parallax [procent]')
ax.set_xlabel(r"Apparent magnitude $G$")
ax.set_ylabel(r"Relative uncertainty on parallax [per cent]")
ax.set_yticks([1, 10, 100, 1000], ["1", "10", "100", "1000"])
ax.set_ylim(0.4, 100)
ax.grid(True, which="both")
ax.legend()

# plt.savefig('relatieve_onzekerheid_vs_schijnbare_helderheid.pdf')

plt.show()
gabsmag = [12, 5, 0.5, -3]
afstand = np.logspace(2, 4, 100)
rel_plx_unc_B = np.zeros((len(gabsmag), afstand.size))

for i, gabs in enumerate(gabsmag):
    gmags = gabs + 5 * np.log10(afstand) - 5
    rel_plx_unc_B[i] = (
        parallax_uncertainty(gmags, release="dr3") / (1000000 / afstand) * 100
    )

fig, ax = plt.subplots(1, 1, figsize=(16, 9))

for i, g in enumerate(gabsmag):
    ax.loglog(afstand, rel_plx_unc_B[i], "-", label=rf"$M_G={g}$")
# ax.set_xlabel(r'Afstand [parsec]')
# ax.set_ylabel(r'Relatieve onzekerheid parallax [procent]')
ax.set_xlabel(r"Distance [parsec]")
ax.set_ylabel(r"Relative uncertainty on parallax [per cent]")
ax.set_yticks([1, 10, 100, 1000], ["1", "10", "100", "1000"])
ax.set_xticks([100, 500, 1000, 5000, 10000], ["100", "500", "1000", "5000", "10000"])
ax.set_ylim(0.1, 100)
ax.grid(True, which="both")
ax.legend()

# plt.savefig('relatieve_onzekerheid_vs_afstand.pdf')

plt.show()